
Interactive Forex Charts
وصف لـInteractive Forex Charts
**Announcement: Market Data updated for v.2.56
Forex is an exciting financial instrument that offers active traders with abundant opportunities to profit from regular price movements. Because of its high liquidity and 24 hour trading, it is ideal for active traders to trade frequently by taking advantage of predictable price swings, range bounded movements, trend following, trend reversals and trend exhaustions. Screenulator with its experience stock charting analysis finally brings the powerful AI chart pattern recognition engine, and industry leading interactive charting app to Forex market.
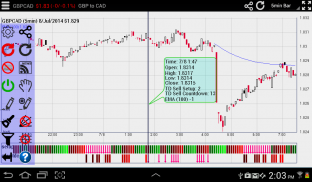
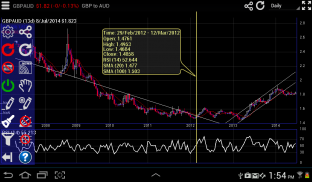
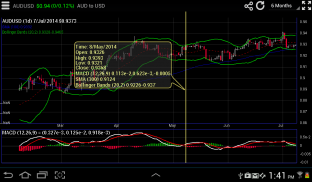
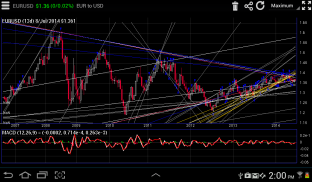
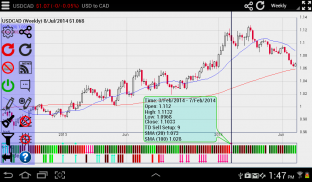
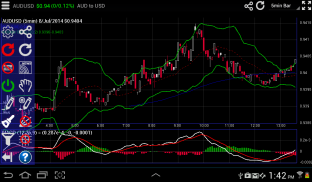
The app is based on Interactive Stock Charts app © with advanced yet intuitive, easy to use touch screen interface allowing you to freely adjust time frame and view technical information with touch of finger: scroll, pan and zoom on a beautiful candlestick charts with gesture and touch control. Swipe to scroll into historical analysis, pinch to zoom and change time frame, touch on price points to show detailed quotes and technical indicator values. Backed by Screenulator's patent pending automated chart pattern and trendline recognition engine, and industry's first Trend Reversal (9,13 count Sequential) pattern screener, and full suite of technical analysis tools, you will have the best analysis tool for Forex trading!
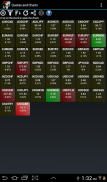
Screenulator.com uses the AI based chart pattern recognition and automated trendline capabilities, as well as state of the art TR/TD short term signals. By using machine Deep Learning Neural Networks algorithms, the selected stocks with desired chart patterns and TR/TD signals are highly reliable and profitable.
About Trend Reversal Indicator:
Screenulator's patent pending Trend Reversal and Exhaustion indicators combines 9,13 counting with trendline analysis to pinpoint trend pivots with color coded visual indicator. It has been shown to have an impressive record of identifying and anticipating turning points across the FX, bond, equity and commodity markets. Furthermore, the indicators provide signals not only on a daily chart but also intraday. It identifies when a trend is becoming, or has become, exhausted. This apps automatically identifies Trend Reversal, Trend Exhaustion, and Perfection criteria. It also calculates stoploss levels. To learn more: http://www.screenulator.com/show_video.php?id=TR_EXAMPLES
http://www.screenulator.com/cgi-bin/v?pid=ref#reversal
Top 40 Forex pairs are supported for both intraday, daily, weekly time frames. You can pinch zoom to change time frames easily. Touch the price candle to display information.
About Trendlines:
A trend line is a bounding line for the price movement of a security. A support trend line (or a bottom line) is formed when a securities price decreases and then rebounds at a pivot point that aligns with at least two previous support pivot points. Trendlines are considered by many expert traders to be the single most important tools in technical analysis. However, Support and Resistance breakout and Triangle patterns are just example of patterns formed by trendlines. This app automatically draws and screens for stocks with specific patterns. To learn more: http://www.screenulator.com/cgi-bin/v?pid=ref#trendlines
Classic TA indicators and overlays: RSI, MACD, SMA, EMA, Bollinger, Donchian, Ichimoku Cloud, Keltner band, Parabolic SAR, SuperTrend, McGinley Dynamic, stochastic, ADX, Aroon, Chaikin, Ultimate, MFI, OBV, ATR, ADL, CCI indicators. Fibonacci Retracement and text annotation tools. Others will available upon requests.
Supported markets:
EOD and intraday data: NASDAQ, NYSE, AMEX, TSX, HKEX, Australia, India (NSE)
EOD data only: JKSE, Shenzhen, Shanghai, Singapore, UK, Paris, Brussels, Amsterdam, Milan, Athens
FOREX: All Forex currency pairs
** إعلان: تجديد بيانات السوق لv.2.56
الفوركس هو أداة مالية المثيرة التي تقدم التجار نشط مع فرص وفيرة للاستفادة من تحركات الأسعار العادية. بسبب السيولة العالية والتداول على مدار 24 ساعة، وهو مثالي للمتداولين النشطين على التجارة في كثير من الأحيان عن طريق الاستفادة من تقلبات الأسعار يمكن التنبؤ بها، ومجموعة الحركات يحدها، الاتجاه التالي، يعكس الاتجاه وexhaustions الاتجاه. Screenulator مع تحليله رسم الأسهم تجربة يجلب أخيرا قوية AI الرسم البياني نمط محرك الاعتراف، والرائدة في صناعة تطبيقات الرسوم البيانية التفاعلية لسوق الفوركس.
ويستند هذا التطبيق على الأوراق المالية التفاعلية المخططات البيانية التطبيق © مع متقدمة بعد بديهية وسهلة الاستخدام واجهة الشاشات التي تعمل باللمس مما يتيح لك ضبط بحرية إطار زمني وعرض المعلومات التقنية مع لمسة من إصبع: انتقل، والتكبير على الرسوم البيانية شمعة جميلة مع لفتة و لمس السيطرة. انتقاد للتمرير إلى التحليل التاريخي، قرصة للتكبير وتغيير الإطار الزمني، أتطرق إلى نقطة السعر لإظهار نقلت مفصلة وقيم المؤشرات الفنية. بدعم من براءات الاختراع في انتظار Screenulator نمط الآلي التخطيط ومحرك التعرف على خط الاتجاه، والأول عكس اتجاه الصناعة (9،13 عدد متسلسل) نمط فرز، ومجموعة كاملة من أدوات التحليل الفني، سيكون لديك أفضل أداة تحليل لتداول العملات الأجنبية!
يستخدم Screenulator.com منظمة العفو الدولية على أساس الاعتراف الرسم البياني نمط وقدرات خط الترند الآلي، فضلا عن حالة إشارات على المدى القصير الفن TR / TD. باستخدام آلة ديب تعلم الشبكات العصبية خوارزميات، وأسهم مختارة مع المطلوب رسم أنماط وTR / إشارات TD هي موثوق بها للغاية ومربحة.
حول المؤشر عكس الاتجاه:
براءة Screenulator في انتظار مؤشرات عكس الاتجاه واستنفاد يجمع بين 9،13 عد مع تحليل خط الاتجاه لتحديد محاور الاتجاه مع ونا مميزا مؤشر مرئي. وقد تبين أن لها سجلا رائعا من تحديد وتوقع نقاط التحول في أسواق العملات والسندات والأسهم والسلع. وعلاوة على ذلك، توفر المؤشرات إشارات ليس فقط على الرسم البياني اليومي ولكن أيضا لحظيا. ويحدد عند وجود اتجاه أصبحت، أو أصبح، استنفدت. هذه التطبيقات تلقائيا يحدد عكس الاتجاه، اتجاه استنفاد، ومعايير الكمال. وتحسب أيضا مستويات stoploss. لمعرفة المزيد: http://www.screenulator.com/show_video.php؟id=TR_EXAMPLES
http://www.screenulator.com/cgi-bin/v؟pid=ref#reversal
يتم دعم أفضل 40 أزواج العملات الأجنبية على حد سواء لحظيا، يوميا، والأطر الزمنية الأسبوعية. يمكنك قرصة التكبير لتغيير الأطر الزمنية بسهولة. المس شمعة السعر لعرض المعلومات.
حول خطوط الاتجاه:
خط الاتجاه هو خط إحاطة للحركة سعر الورقة المالية. ويتكون خط دعم الاتجاه (أو بيت القصيد) عندما ينخفض سعر الأوراق المالية وثم ارتدت في النقطة المحورية التي تؤيد مع اثنين على الأقل من نقاط الدعم المحوري السابقة. وتعتبر خطوط الاتجاه من قبل العديد من التجار الخبير أن تكون واحدة أهم الأدوات في التحليل الفني. ومع ذلك، دعم واندلاع المقاومة والمثلث أنماط هي مثال العادل للأنماط التي شكلتها خطوط الاتجاه. هذا التطبيق تلقائيا تعادلات وشاشات للأسهم مع أنماط محددة. لمعرفة المزيد: http://www.screenulator.com/cgi-bin/v؟pid=ref#trendlines
المؤشرات الكلاسيكية TA وتراكب: RSI، MACD، SMA، EMA، بولنجر، Donchian، إيشيموكو الغيمة، والفرقة كيلتنر، مكافئ SAR، SuperTrend، McGinley الحيوي، مؤشر ستوكاستيك، ADX، أرون، Chaikin، في نهاية المطاف، MFI، OBV، ATR، ADL، مؤشرات CCI. فيبوناتشي وأدوات الشرح النص. والبعض الآخر المتاحة بناء على طلبات.
الأسواق المعتمدة:
التخلص من الذخائر المتفجرة واللحظي البيانات: NASDAQ، NYSE، AMEX، TSX، بورصة هونج كونج، أستراليا، الهند (NSE)
بيانات EOD فقط: JKSE، وشنتشن وشانغهاى وسنغافورة والمملكة المتحدة وباريس وبروكسل وأمستردام وميلانو وأثينا
FOREX: جميع أزواج العملات الفوركس
Interactive Forex Charts - معلومات APK
نُسخة APK: 2.34الحزمة: com.screenulator.forexآخر إصدار من Interactive Forex Charts
نُسخ أخرى


تطبيقات من الفئة نفسها